Writing applications that use the massive parallel compute power of the CUDA capable GPUs has been made even more simpler with the release of CUDA Toolkit 3.2 RC. What’s more exciting is that it comes with an improved CUDA Visual Profiler which lets you profile every minute aspect of your application. Today I am going to walk you through the simple process of profiling your CUDA application.
Before we start…
Make sure you have the right stuff:
- Latest CUDA driver (At the time of writing, the latest driver is 260.99 for Win7 x64)
- CUDA toolkit 3.2 RC (Release Candidate 2 has also been released today)
- Visual Studio 2010/2008 (Not really needed but you got to have your application’s executable for profiling)
Setting up the Profiler
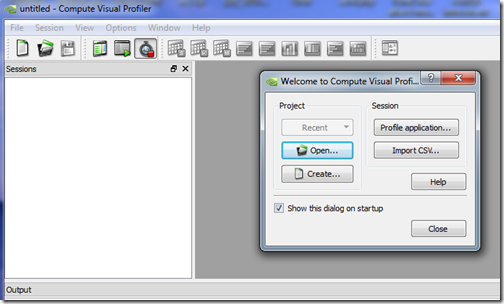
Once you have installed the latest CUDA toolkit 3.2RC, fire up the NVIDIA Visual Profiler

(A shortcut to the Profiler is also placed on the desktop just in case you’re struggling)
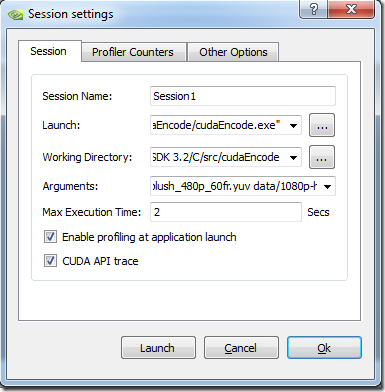
Since this would be your first time, click on Profile application button in the dialog box. Session settings dialog box will appear. Click on Launch and then browse to the executable of your CUDA application. I am going to use a sample application that comes with the NVIDIA CUDA SDK (cudaEncode.exe to be precise):
Profiling the Application
Notice that I have reduced the maximum execution time from the default 30secs to 2secs (Leave it to the default if you’re not sure how long 1 run of the application would take). Leave all the other settings at their default values and click Launch button. There will be 10 iterations and each iteration will have multiple runs of the applications. The profiling results of each iteration are written in a csv (Comma Separated Values) file in the working directory. Once the iterations are complete, you’ll notice a couple of files generated in the working directory. Those are the profiling results.
Viewing the Profiled Results
As already said, almost every aspect of your CUDA application is profiled. In order to see the results go to File –> Import and browse to your working directory and load any one of the 10 generated CSV files. You’ll notice that the right pane is populated with the profile results. In order to view it graphically, you can choose from a list of different views from the top button panel:
For example, the GPU Time Summary plot details the percentage of total GPU time taken by all the individual kernels and functions like memory transfer etc.
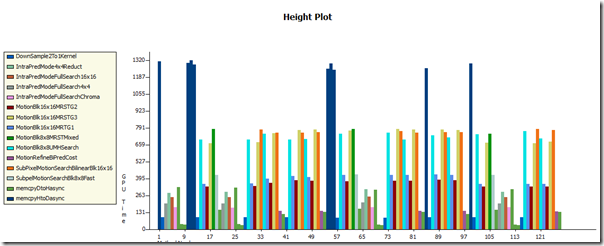
The GPU Time Height plot tells us precisely how much clocks (time is in millisecond resolution) each function/kernel took. You don’t need to time your kernels manually anymore!
If you have any questions then simple leave it in the comments below and we’ll get back to you ASAP OR alternatively, leave them in our forums and the response will be even more quicker.


